
September 2024 GA4 & GMP Updates
Stay informed with the latest September 2024 updates to Google Analytics 4 (GA4) and Google Marketing Platform (GMP). Learn about new features, enhanced reporting tools, and best practices to optimize your digital marketing strategy

Napkyn
Google Analytics 4 Updates
Improved Session Attribution in GA4 for User-Provided Data
Google Analytics 4 has addressed an issue where sessions were being over-attributed to "Direct" traffic. This problem occurred when using user-provided data with automatic collection or affected customers already using this feature from late June to mid-July. With the recent fix, session attribution should now be more accurate, providing clearer insights for data-driven decision-making.
Improvements to GA4 Data Import
The recent improvements to Google Analytics 4 (GA4) data import bring significant enhancements to flexibility and efficiency. One of the key updates is the ability to create and manage multiple data sources for each data type, which makes it easier to handle complex data integration needs without the risk of overwriting existing data. This means that newly imported data is seamlessly added or updated, preserving historical data intact.
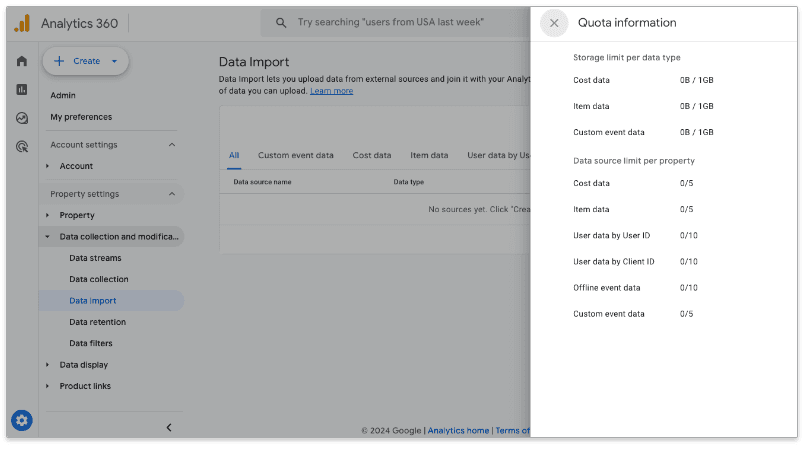
Another helpful feature is that data import quotas and limitations are now accessible directly in the data import section of the GA4 admin interface. You can easily track how much data you’ve imported and ensure you stay within limits, such as the 120 daily uploads per property limit. The newly added data can also be immediately used as audience criteria, making it easier to include relevant users in existing GA4 audiences without any additional configuration steps.

Report enhancements
You can now visualize up to 5 rows of data directly within your detail reports using plot rows. Simply select the desired rows and click Plot rows to generate a line for each row for quick comparison and analysis.

Google Analytics 4 has introduced several new features to enhance reporting capabilities:
Anomalies in Detail Reports: Automatically identify unusual data patterns, like unexpected traffic spikes or sudden drops, to quickly address potential issues. Learn more about anomalies
Report Descriptions: Hover over report titles for brief descriptions and links to learn more about each report.
Mark Key Events: Highlight your most important events directly in the Events report, making key data points easily accessible. Learn more about the Events report
New Transactions Report: Dive into detailed insights on each transaction with the new Transactions report. Learn more about the new report
Enhanced Acquisition Reports: Improved scope differentiation for user and session metrics in acquisition reports for more refined analysis. Learn more about the acquisition reports
Looker Studio Updates
Funnel Charts
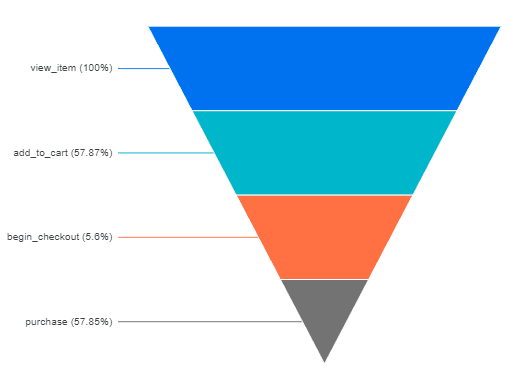
Looker Studio has recently rolled out a new feature—funnel charts. This powerful addition allows users to visually represent the conversion stages within their data, making it easier to analyze and identify drop-off points in processes like customer journeys or sales funnels. With funnel charts, you can now better understand how users progress through each stage, making insights more actionable and helping to improve strategies for conversion optimization. You can choose from 3 options:
Inverted Triangle

Stepped Bar

Smoothed Bar

You can set up the labels to show the Number, Percentage or Number +Percentage. You can also choose the Percentage to show as % of max or % of previous step.
Microsoft Excel connector
The Microsoft Excel connector in Looker Studio provides an easy way to directly access and visualize data stored in Excel worksheets. With this integration, users can connect to Excel files, allowing them to pull relevant data into their reports and dashboards without manually exporting or importing files. This streamlines the data analysis process, making it more efficient to combine Excel data with other sources in Looker Studio.
Gemini in Looker Studio Pro
Looker Studio Pro users can nowand from Looker Studio content using Gemini assistance.
Looker Studio Pro introduces "Gemini," an AI-powered assistance feature to enhance productivity. Users can now create calculated fields more efficiently with the help of Gemini's intelligent suggestions, making it easier to manipulate and analyze data. Additionally, users can generate presentations in Google Slides directly from Looker Studio content, providing a seamless workflow for sharing insights with stakeholders.
Text Wrapping in Pivot Table column headers
Looker Studio's pivot table visualization has been updated to support text wrapping for column headers. By enabling the Wrap text option in the Style tab, users can now display longer header text without it being cut off. This feature enhances readability, especially for data-heavy tables with descriptive column names, making it easier to interpret information at a glance.
New Connectors
Looker Studio continues to expand its connectivity by adding new partner integrations. One recent addition is the ClickUp connector, which allows users to connect their ClickUp boards to Looker Studio. This enables data from ClickUp, such as tasks, project statuses, and timelines, to be analyzed and visualized in Looker Studio, providing enhanced reporting capabilities for project management data.
BigQuery Updates
These updates bring more flexibility, advanced ML capabilities, enhanced security, and operational insight to BigQuery users.
Client Library Updates
Several bug fixes and changes to dependencies for BigQuery libraries across Node.js, Python, and Go.
Flexible Column Names
Users can now use flexible column names in tables and views for easier data extraction and manipulation.
Operational Health Dashboard
A new real-time dashboard provides insights into key metrics like slot and shuffle usage, helping users monitor operational health effectively.
BigQuery ML Enhancements
Expanded support for creating multimodal embeddings, document processing using Document AI, and audio transcription with Speech-to-Text.
Materialized View Replicas
You can now create materialized view replicas directly from the Google Cloud Console.
Workflow Automation
A new feature in preview allows scheduling workflows to execute code assets in sequence.
Model Monitoring
Functions like ML.DESCRIBE_DATA, ML.VALIDATE_DATA_SKEW, and ML.VALIDATE_DATA_DRIFT are now generally available, providing enhanced monitoring of model performance.
Vector Search and Index
Use vector indexes to enhance the efficiency of embedding searches, allowing for a more effective retrieval of semantically similar data.
Cloud KMS Autokey
Automate creation and management of customer-managed encryption keys (CMEKs) for secure data handling.
New Acquisition Reports
Updated acquisition reports now provide improved separation of user and session metrics for better analysis.
Display & Video 360 Updates
Bidding Changes
Starting October 23, DV360 will stop bidding on multiple waterfall calls to Google Ad Manager and AdMob Network for mobile app inventory, focusing on real-time bidding for better efficiency. Read more
Bid Guidance and Optimized Targeting
Bid suggestions will now be surfaced for YouTube & partners line items. Optimized targeting options for certain viewability metrics will be removed after September 30. Read more
Demand Gen Campaigns
Launching in October, with features like expanded reach to Discover and Gmail, and multi-format creative storytelling. Read more
Enhanced Attribution
Enabled for all advertisers from September 30 for more accurate conversion attribution. Read more
Reporting Changes
EMX Digital renamed Cadent Aperture MX. Regulatory Operating Costs and Total Media Cost metrics will be incompatible with YouTube-specific metrics. Read more
These updates streamline campaign management, enhance targeting, and improve bidding efficiency within DV360.
More Insights


How to Audit Google Analytics 4 (GA4): Common Issues and Their Impacts on Your Data

Hasan Alanam
Manager, Data Solutions
Feb 14, 2025
Read More


Cookie Compliance Explained: Key Privacy Laws and Best Practices for Websites

Rob English
Lead Product Specialist
Feb 12, 2025
Read More


Impact of Consent Mode on Reporting and Transaction Data in GA4

Trisha Patel
Senior Analyst, Data Solutions
Feb 5, 2025
Read More
More Insights
Sign Up For Our Newsletter

Napkyn Inc.
204-78 George Street, Ottawa, Ontario, K1N 5W1, Canada
Napkyn US
6 East 32nd Street, 9th Floor, New York, NY 10016, USA
212-247-0800 | info@napkyn.com

September 2024 GA4 & GMP Updates
Stay informed with the latest September 2024 updates to Google Analytics 4 (GA4) and Google Marketing Platform (GMP). Learn about new features, enhanced reporting tools, and best practices to optimize your digital marketing strategy

Napkyn
Google Analytics 4 Updates
Improved Session Attribution in GA4 for User-Provided Data
Google Analytics 4 has addressed an issue where sessions were being over-attributed to "Direct" traffic. This problem occurred when using user-provided data with automatic collection or affected customers already using this feature from late June to mid-July. With the recent fix, session attribution should now be more accurate, providing clearer insights for data-driven decision-making.
Improvements to GA4 Data Import
The recent improvements to Google Analytics 4 (GA4) data import bring significant enhancements to flexibility and efficiency. One of the key updates is the ability to create and manage multiple data sources for each data type, which makes it easier to handle complex data integration needs without the risk of overwriting existing data. This means that newly imported data is seamlessly added or updated, preserving historical data intact.
Another helpful feature is that data import quotas and limitations are now accessible directly in the data import section of the GA4 admin interface. You can easily track how much data you’ve imported and ensure you stay within limits, such as the 120 daily uploads per property limit. The newly added data can also be immediately used as audience criteria, making it easier to include relevant users in existing GA4 audiences without any additional configuration steps.

Report enhancements
You can now visualize up to 5 rows of data directly within your detail reports using plot rows. Simply select the desired rows and click Plot rows to generate a line for each row for quick comparison and analysis.

Google Analytics 4 has introduced several new features to enhance reporting capabilities:
Anomalies in Detail Reports: Automatically identify unusual data patterns, like unexpected traffic spikes or sudden drops, to quickly address potential issues. Learn more about anomalies
Report Descriptions: Hover over report titles for brief descriptions and links to learn more about each report.
Mark Key Events: Highlight your most important events directly in the Events report, making key data points easily accessible. Learn more about the Events report
New Transactions Report: Dive into detailed insights on each transaction with the new Transactions report. Learn more about the new report
Enhanced Acquisition Reports: Improved scope differentiation for user and session metrics in acquisition reports for more refined analysis. Learn more about the acquisition reports
Looker Studio Updates
Funnel Charts
Looker Studio has recently rolled out a new feature—funnel charts. This powerful addition allows users to visually represent the conversion stages within their data, making it easier to analyze and identify drop-off points in processes like customer journeys or sales funnels. With funnel charts, you can now better understand how users progress through each stage, making insights more actionable and helping to improve strategies for conversion optimization. You can choose from 3 options:
Inverted Triangle

Stepped Bar

Smoothed Bar

You can set up the labels to show the Number, Percentage or Number +Percentage. You can also choose the Percentage to show as % of max or % of previous step.
Microsoft Excel connector
The Microsoft Excel connector in Looker Studio provides an easy way to directly access and visualize data stored in Excel worksheets. With this integration, users can connect to Excel files, allowing them to pull relevant data into their reports and dashboards without manually exporting or importing files. This streamlines the data analysis process, making it more efficient to combine Excel data with other sources in Looker Studio.
Gemini in Looker Studio Pro
Looker Studio Pro users can nowand from Looker Studio content using Gemini assistance.
Looker Studio Pro introduces "Gemini," an AI-powered assistance feature to enhance productivity. Users can now create calculated fields more efficiently with the help of Gemini's intelligent suggestions, making it easier to manipulate and analyze data. Additionally, users can generate presentations in Google Slides directly from Looker Studio content, providing a seamless workflow for sharing insights with stakeholders.
Text Wrapping in Pivot Table column headers
Looker Studio's pivot table visualization has been updated to support text wrapping for column headers. By enabling the Wrap text option in the Style tab, users can now display longer header text without it being cut off. This feature enhances readability, especially for data-heavy tables with descriptive column names, making it easier to interpret information at a glance.
New Connectors
Looker Studio continues to expand its connectivity by adding new partner integrations. One recent addition is the ClickUp connector, which allows users to connect their ClickUp boards to Looker Studio. This enables data from ClickUp, such as tasks, project statuses, and timelines, to be analyzed and visualized in Looker Studio, providing enhanced reporting capabilities for project management data.
BigQuery Updates
These updates bring more flexibility, advanced ML capabilities, enhanced security, and operational insight to BigQuery users.
Client Library Updates
Several bug fixes and changes to dependencies for BigQuery libraries across Node.js, Python, and Go.
Flexible Column Names
Users can now use flexible column names in tables and views for easier data extraction and manipulation.
Operational Health Dashboard
A new real-time dashboard provides insights into key metrics like slot and shuffle usage, helping users monitor operational health effectively.
BigQuery ML Enhancements
Expanded support for creating multimodal embeddings, document processing using Document AI, and audio transcription with Speech-to-Text.
Materialized View Replicas
You can now create materialized view replicas directly from the Google Cloud Console.
Workflow Automation
A new feature in preview allows scheduling workflows to execute code assets in sequence.
Model Monitoring
Functions like ML.DESCRIBE_DATA, ML.VALIDATE_DATA_SKEW, and ML.VALIDATE_DATA_DRIFT are now generally available, providing enhanced monitoring of model performance.
Vector Search and Index
Use vector indexes to enhance the efficiency of embedding searches, allowing for a more effective retrieval of semantically similar data.
Cloud KMS Autokey
Automate creation and management of customer-managed encryption keys (CMEKs) for secure data handling.
New Acquisition Reports
Updated acquisition reports now provide improved separation of user and session metrics for better analysis.
Display & Video 360 Updates
Bidding Changes
Starting October 23, DV360 will stop bidding on multiple waterfall calls to Google Ad Manager and AdMob Network for mobile app inventory, focusing on real-time bidding for better efficiency. Read more
Bid Guidance and Optimized Targeting
Bid suggestions will now be surfaced for YouTube & partners line items. Optimized targeting options for certain viewability metrics will be removed after September 30. Read more
Demand Gen Campaigns
Launching in October, with features like expanded reach to Discover and Gmail, and multi-format creative storytelling. Read more
Enhanced Attribution
Enabled for all advertisers from September 30 for more accurate conversion attribution. Read more
Reporting Changes
EMX Digital renamed Cadent Aperture MX. Regulatory Operating Costs and Total Media Cost metrics will be incompatible with YouTube-specific metrics. Read more
These updates streamline campaign management, enhance targeting, and improve bidding efficiency within DV360.
More Insights

Consent Mode: Privacy-First Data Collection in Google Analytics

Jasmine Libert
Senior Vice President, Data Solutions
Feb 19, 2025
Read More

How to Audit Google Analytics 4 (GA4): Common Issues and Their Impacts on Your Data

Hasan Alanam
Manager, Data Solutions
Feb 14, 2025
Read More

Cookie Compliance Explained: Key Privacy Laws and Best Practices for Websites

Rob English
Lead Product Specialist
Feb 12, 2025
Read More
More Insights
Sign Up For Our Newsletter


